
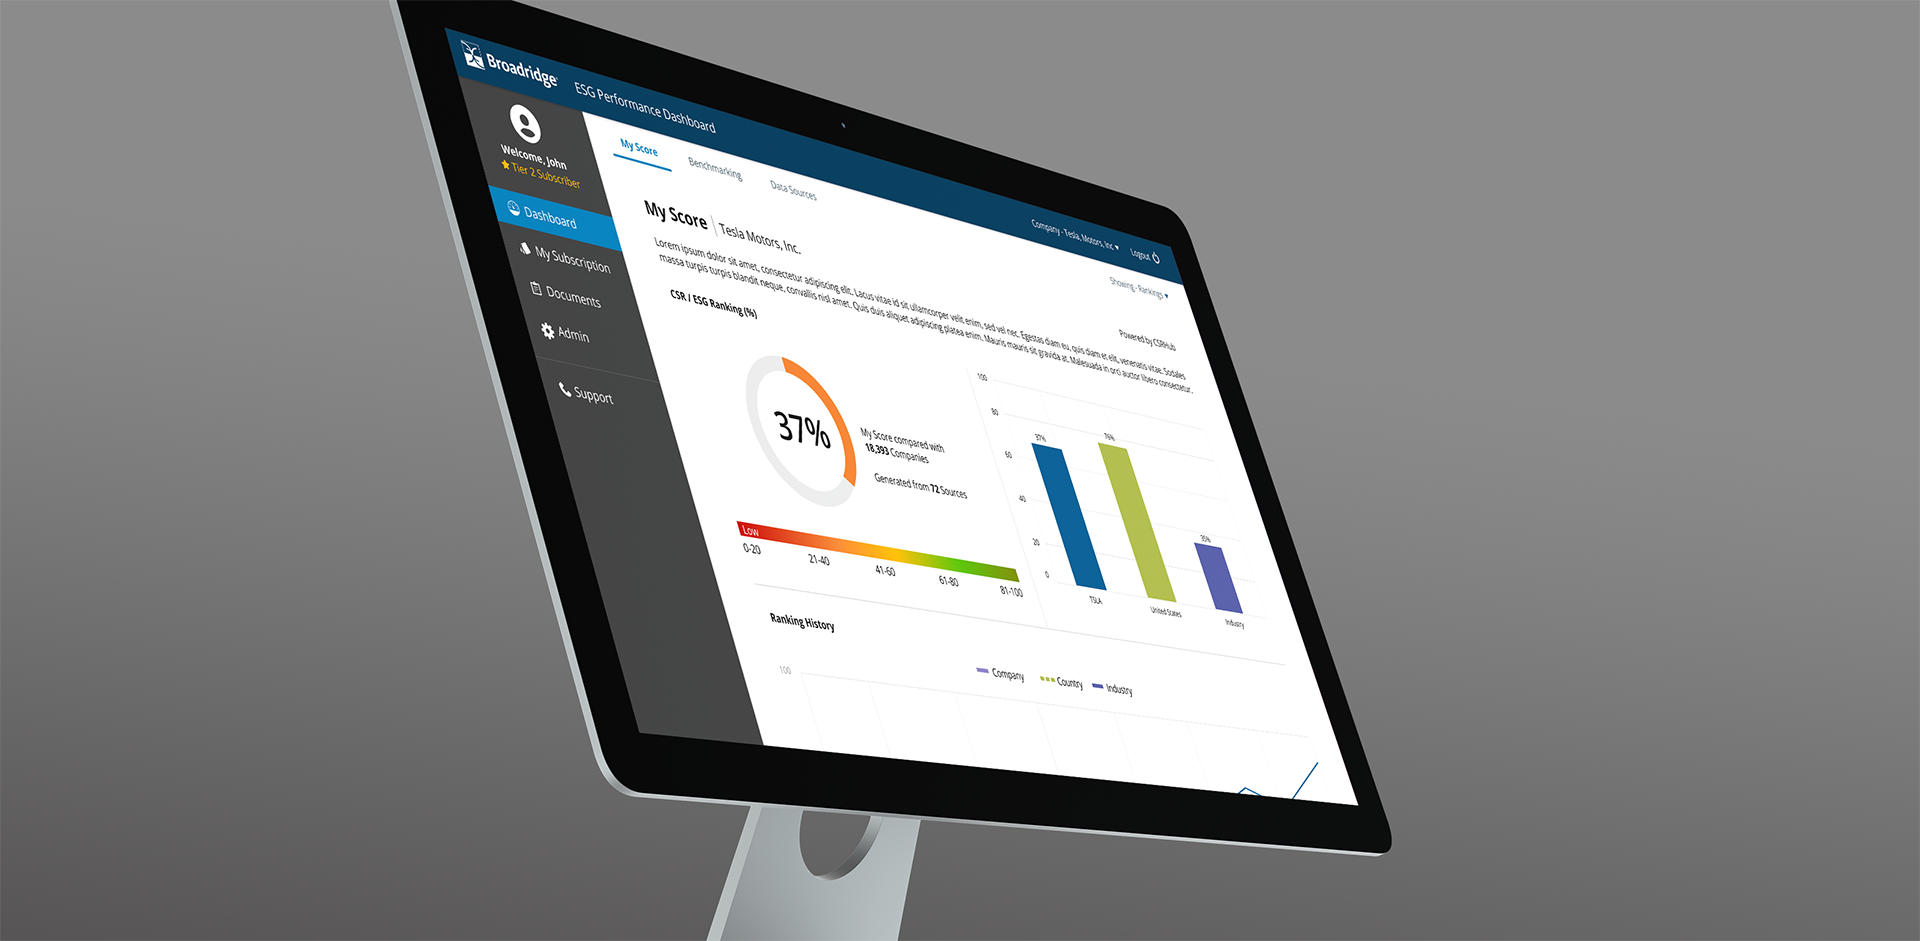
ESG Dashboard
Environmental, Social, and Corporate Governance (ESG) refers to the three central factors in measuring the sustainability and societal impact of an investment in a company or business. ESG Performance Dashboard is a collaborative project between CSRHub and Broadridge. It's a brand new digital platform for viewing and managing ESG scores between multiple companies.
My Role: Lead UX Designer, Product Designer
Tags: Product Design, UX Design & Research
The Research
Business Justification
An ESG score promotes transparency based on public data. Being a considerable new factor of investment in the age of green companies, there aren’t a lot of ESG digital platforms available in the industry. Broadridge, as a model of innovative technologies, purchased CSRHub’s API to build and calculate an ESG score. ESG Performance Dashboard is Broadridge’s new application to host this score and integrate it into Broadridge’s consumer facing product landscape, both increasing the value of being a Broadridge customer and adding a new source of revenue for the company.
Competition Analysis

MCSI
Strengths: Clear visual hierarchy, easy to read charts, descriptive text around charts, Has easy to understand ESG scores, Easy to identify where to search company, Color palette to describe ESG is intuitive, Great videos for resources
Weaknesses: No benchmarking tool to compare with other companies, Can only view 1 ESG score at the same time
Sustainalytics
Strengths: Clean white design, Great focus on ESG score with large font, Great videos for learning what ESG is, There are other resources in the application
Weaknesses: Overwhelming navigation menu, hidden menu makes it harder to find what users are looking for
Personas and User Stories

James McCarthy
Mechanical Engineer
Likes: Speedy technology, coffee, video games, investments, plants, dog lover, Science Shows, Fitness, Real Estate, Design
Dislikes: Long commutes, cats, confusing technology, Slow internet

Jamala Stevens
Broadridge Associate
Likes: Coffee, Starbucks, Plants, Knitting, Reading, Memoirs, Voleyball
Dislikes: Complicated menus, slow internet, Password requirements
As an Investor...
I need to view my ESG Score with charts and illustrations explaining my score. I need to be able to look up and add additional companies to compare my company’s score with. I need to be able to see the average ESG score of the industry of my company. I need to be able to see a way to see the different data sources on how my ESG score was calculated. I need to be able to somehow export a report on my ESG with clear descriptions on how the company attained the score. I need to be able to see the history of my ESG score.
As a Broadridge Employee...
I need to be able to select a company and view the application from their point of view. I need to be able to view a user’s role settings and change their membership status to change what they are able to do within an application. I need to be able too view reports and download them.
The Ideation
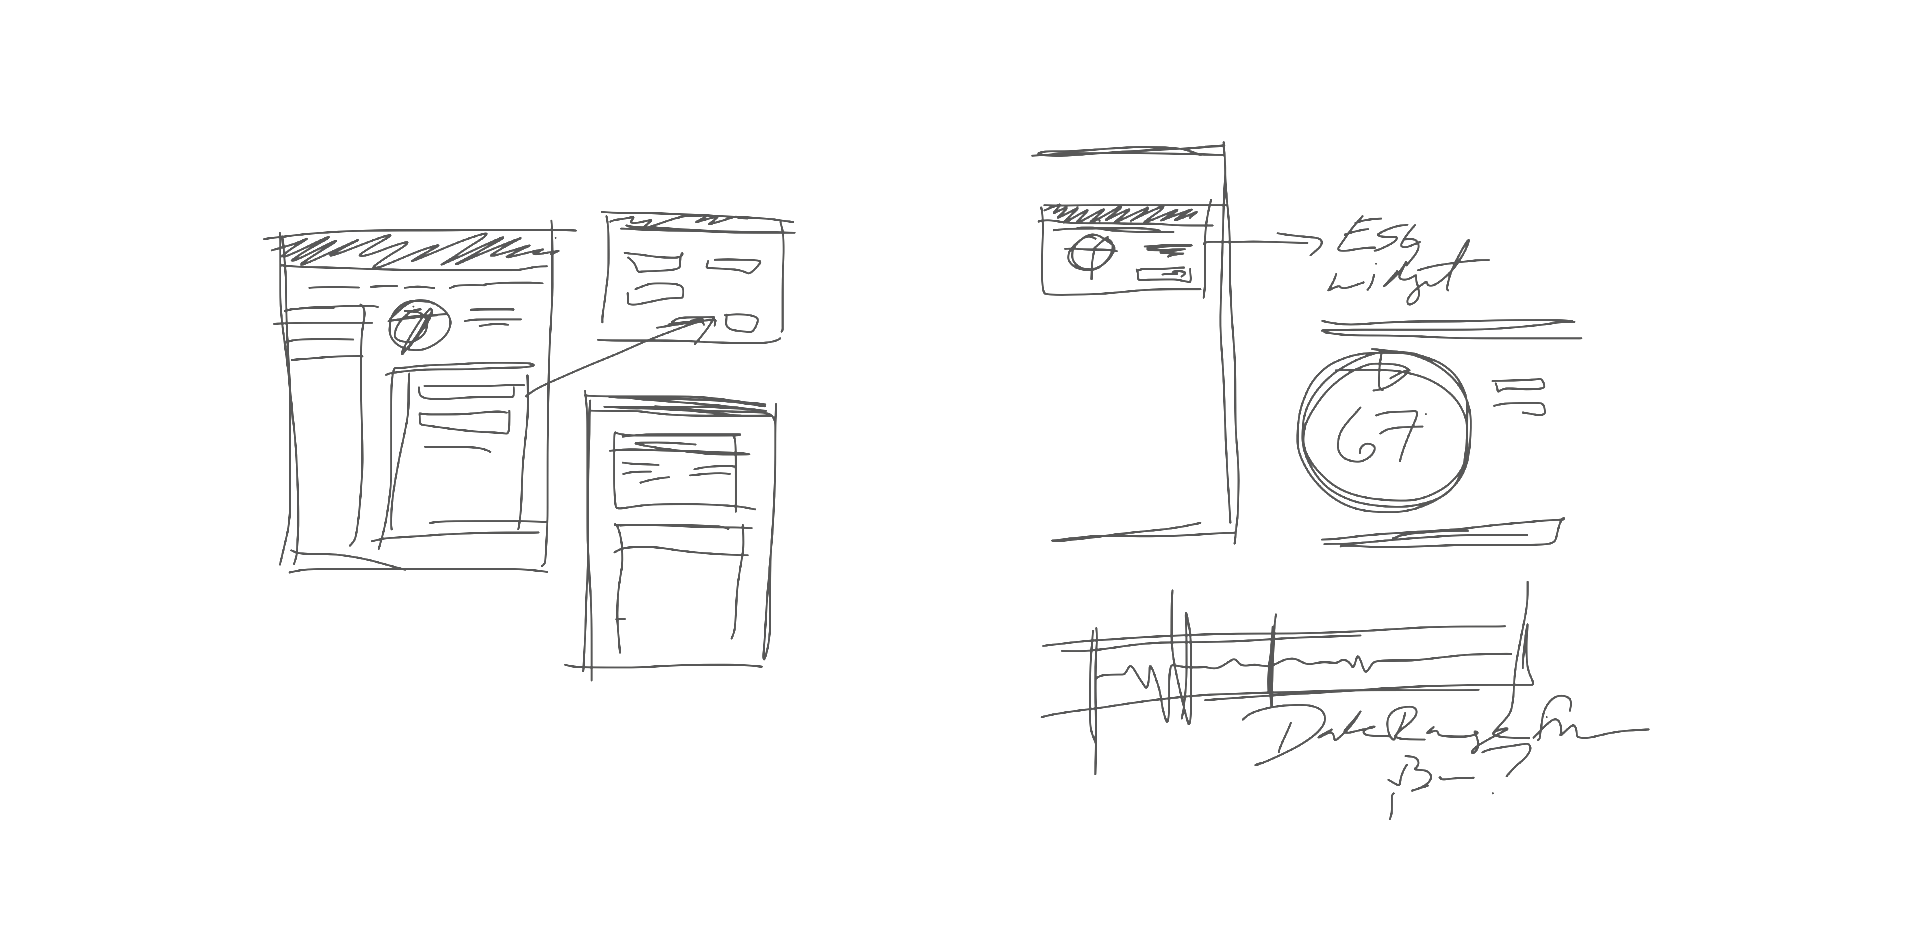
Sketches and Early Mockups
After research, first step to design the new application is to come up with solutions that would meet both the business requirements and the user stories. Each sketch, ideation, and mood boards are all based on the personas that were established. The application requires a small number of pages and the structure should be simple.
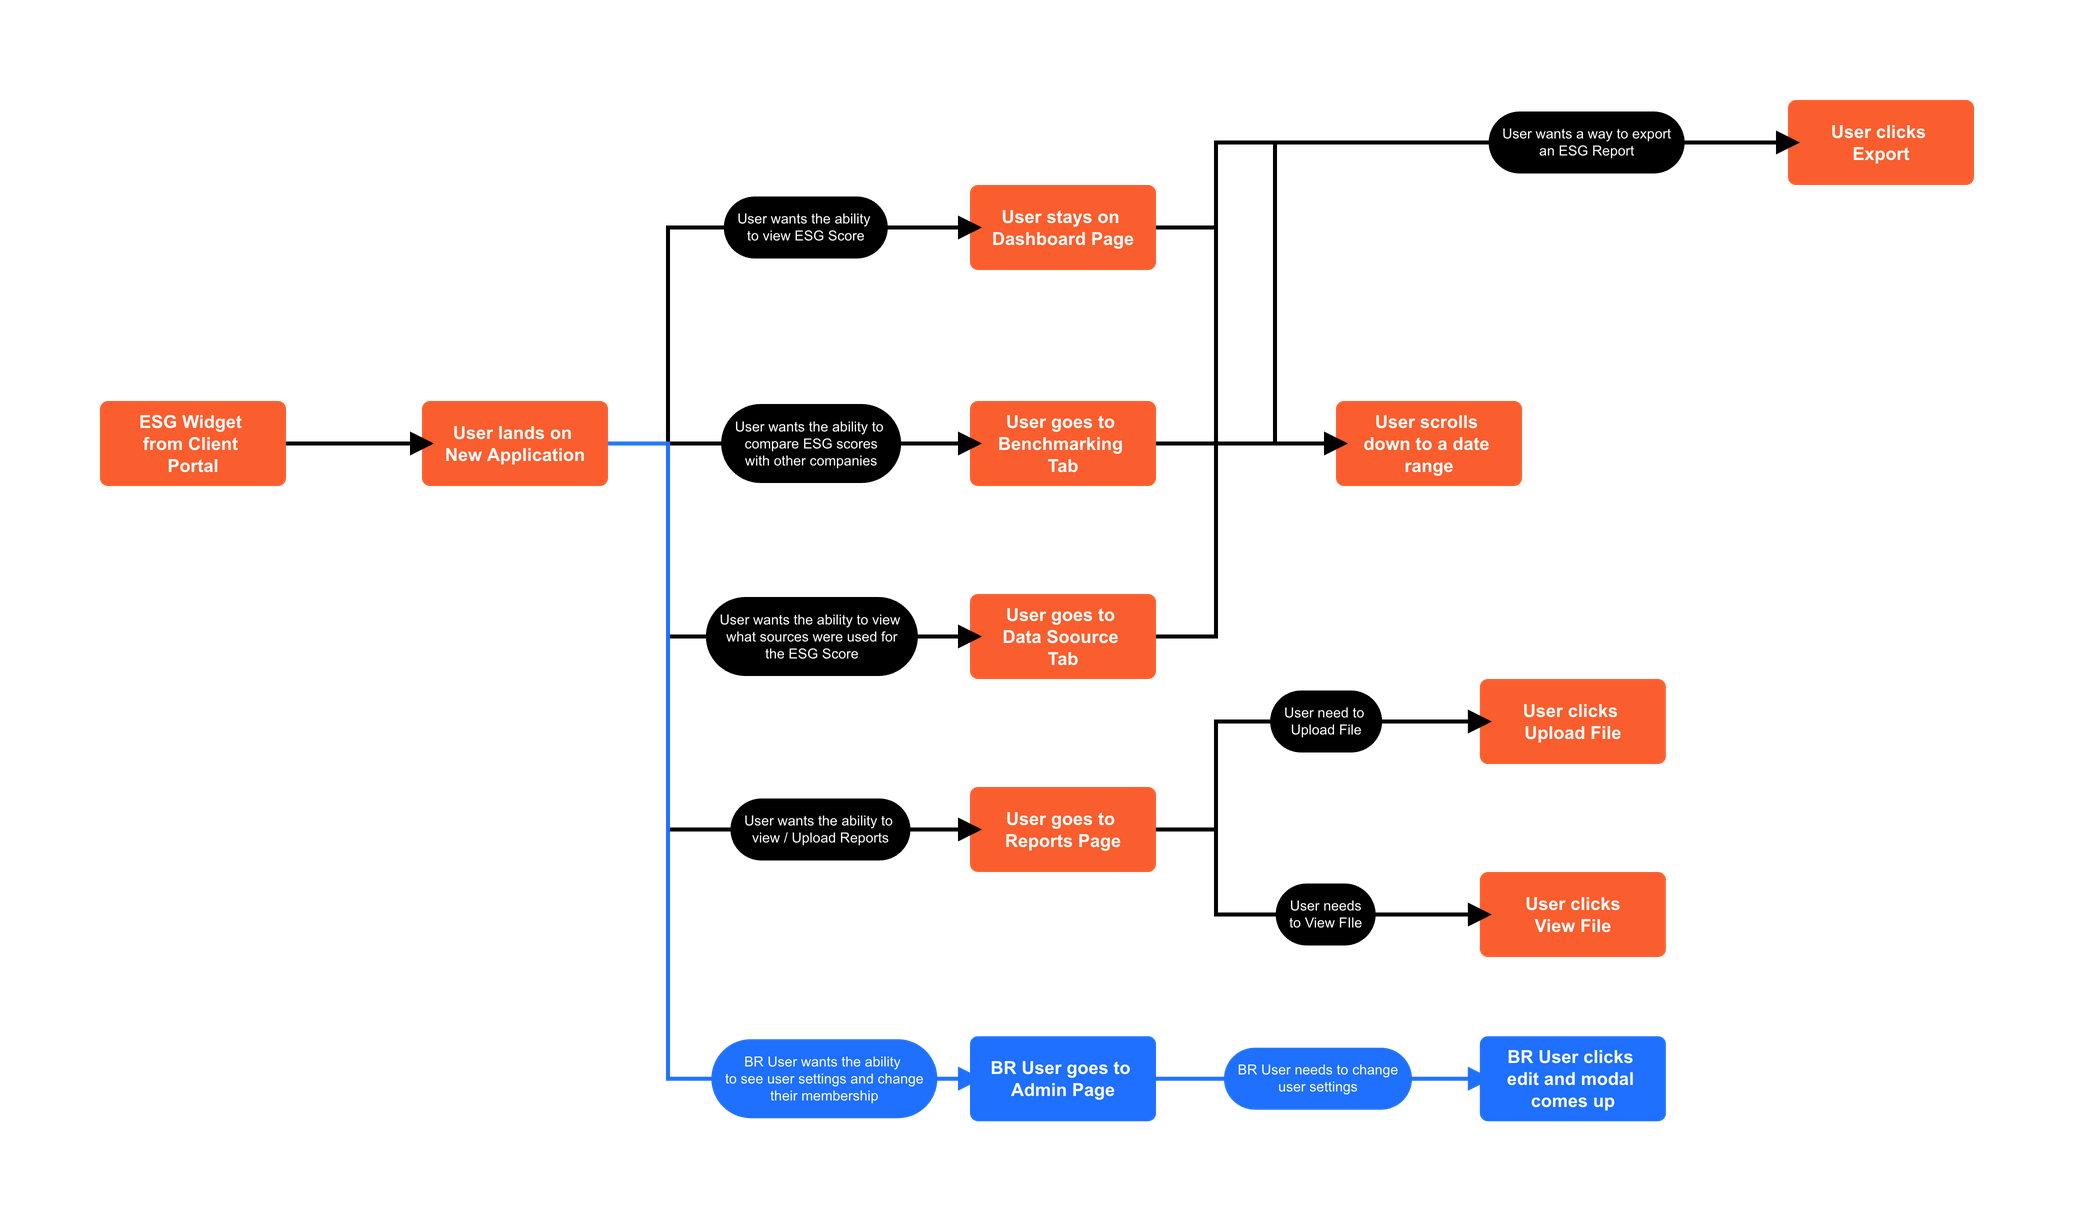
User Flows
There are two main user flows. One for a regular client and one for a Broadridge Associate. A BR Associate should have everything a regular client sees with the addition of having access to an Administration screen.
Low Fidelity Mockups
These low fidelity mockups were used as a layout guide for the application.

The Design
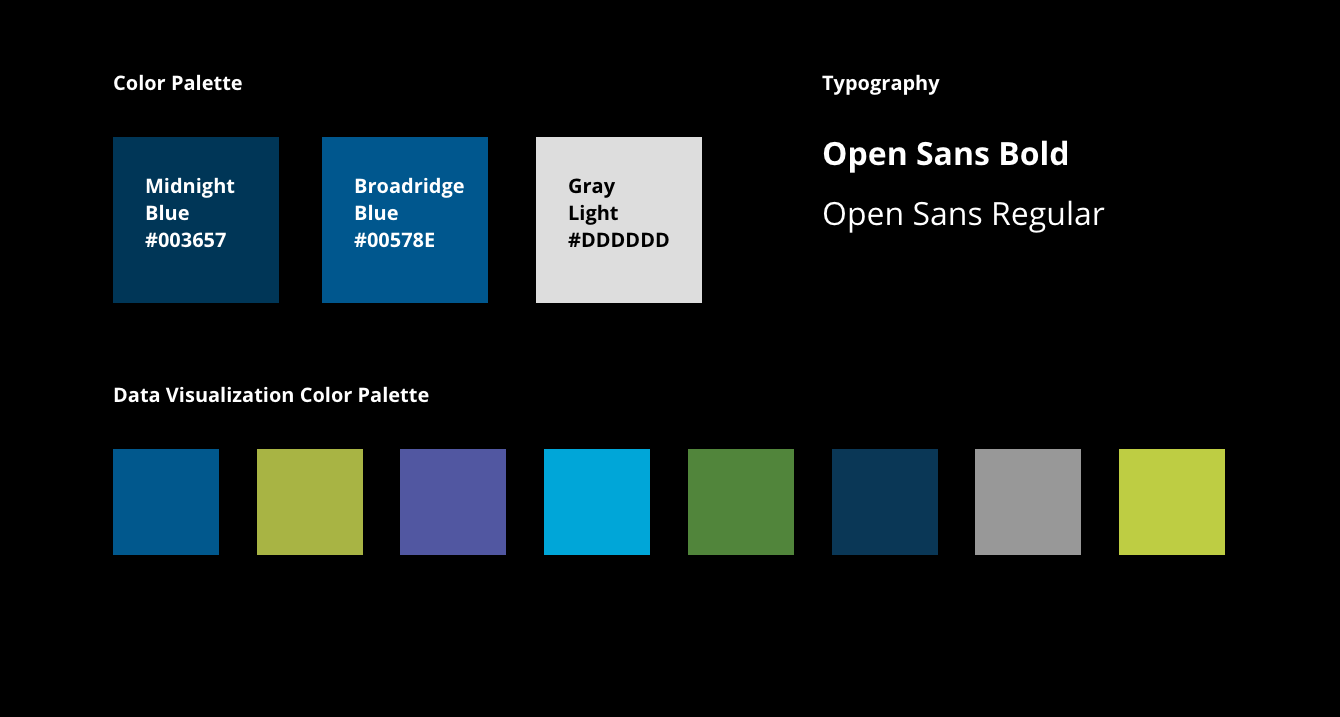
Style Guide
The design of the application follows Broadridge's Design System. A design pattern library created by my team. Form components are using Material Design.
High Fidelity User Flows and Mockups
Benchmarking User Flow
The Benchmarking tool consists of the main Dashboard page, the Benchmarking page, and the Data Sources page. This user flow follows the relationship of the three pages.

Broadridge Associate User Flow
A Broadridge Associate has access to two additional screens. Screens that manage reports and subscriptions follow other Broadridge application's experience.
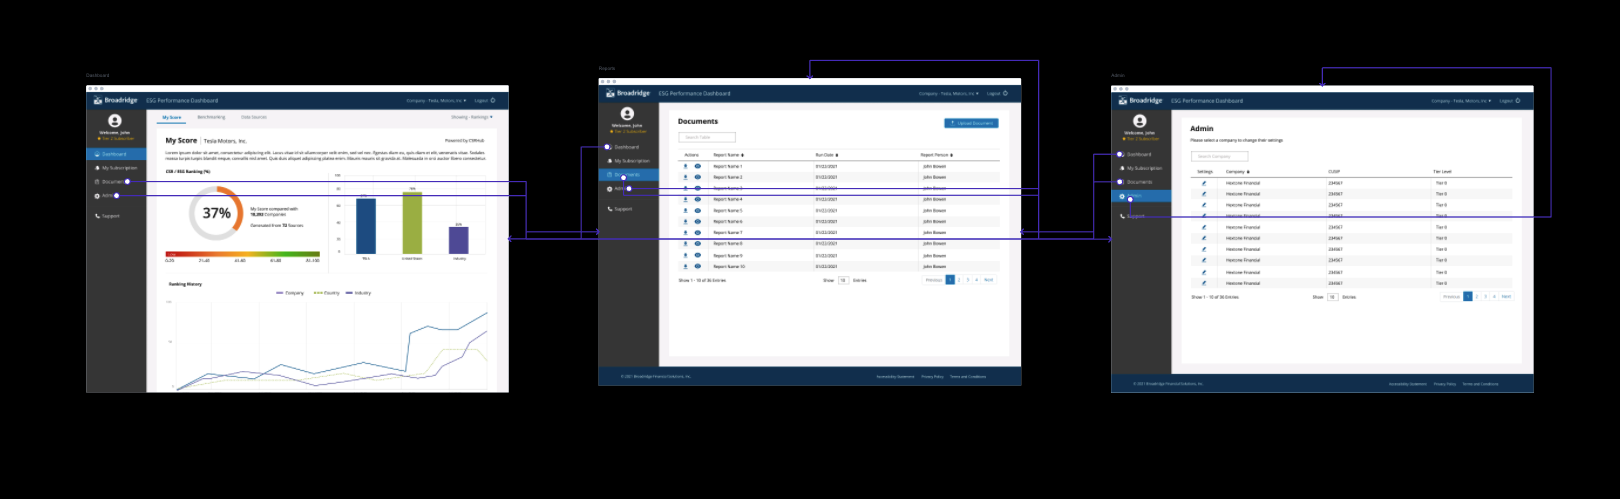
The Final Product
Three different sets of wireframes were created based on the membership of the user. The application is exclusive to Desktop and notepads. The application is integrated with Broadridge's Single Sign On.
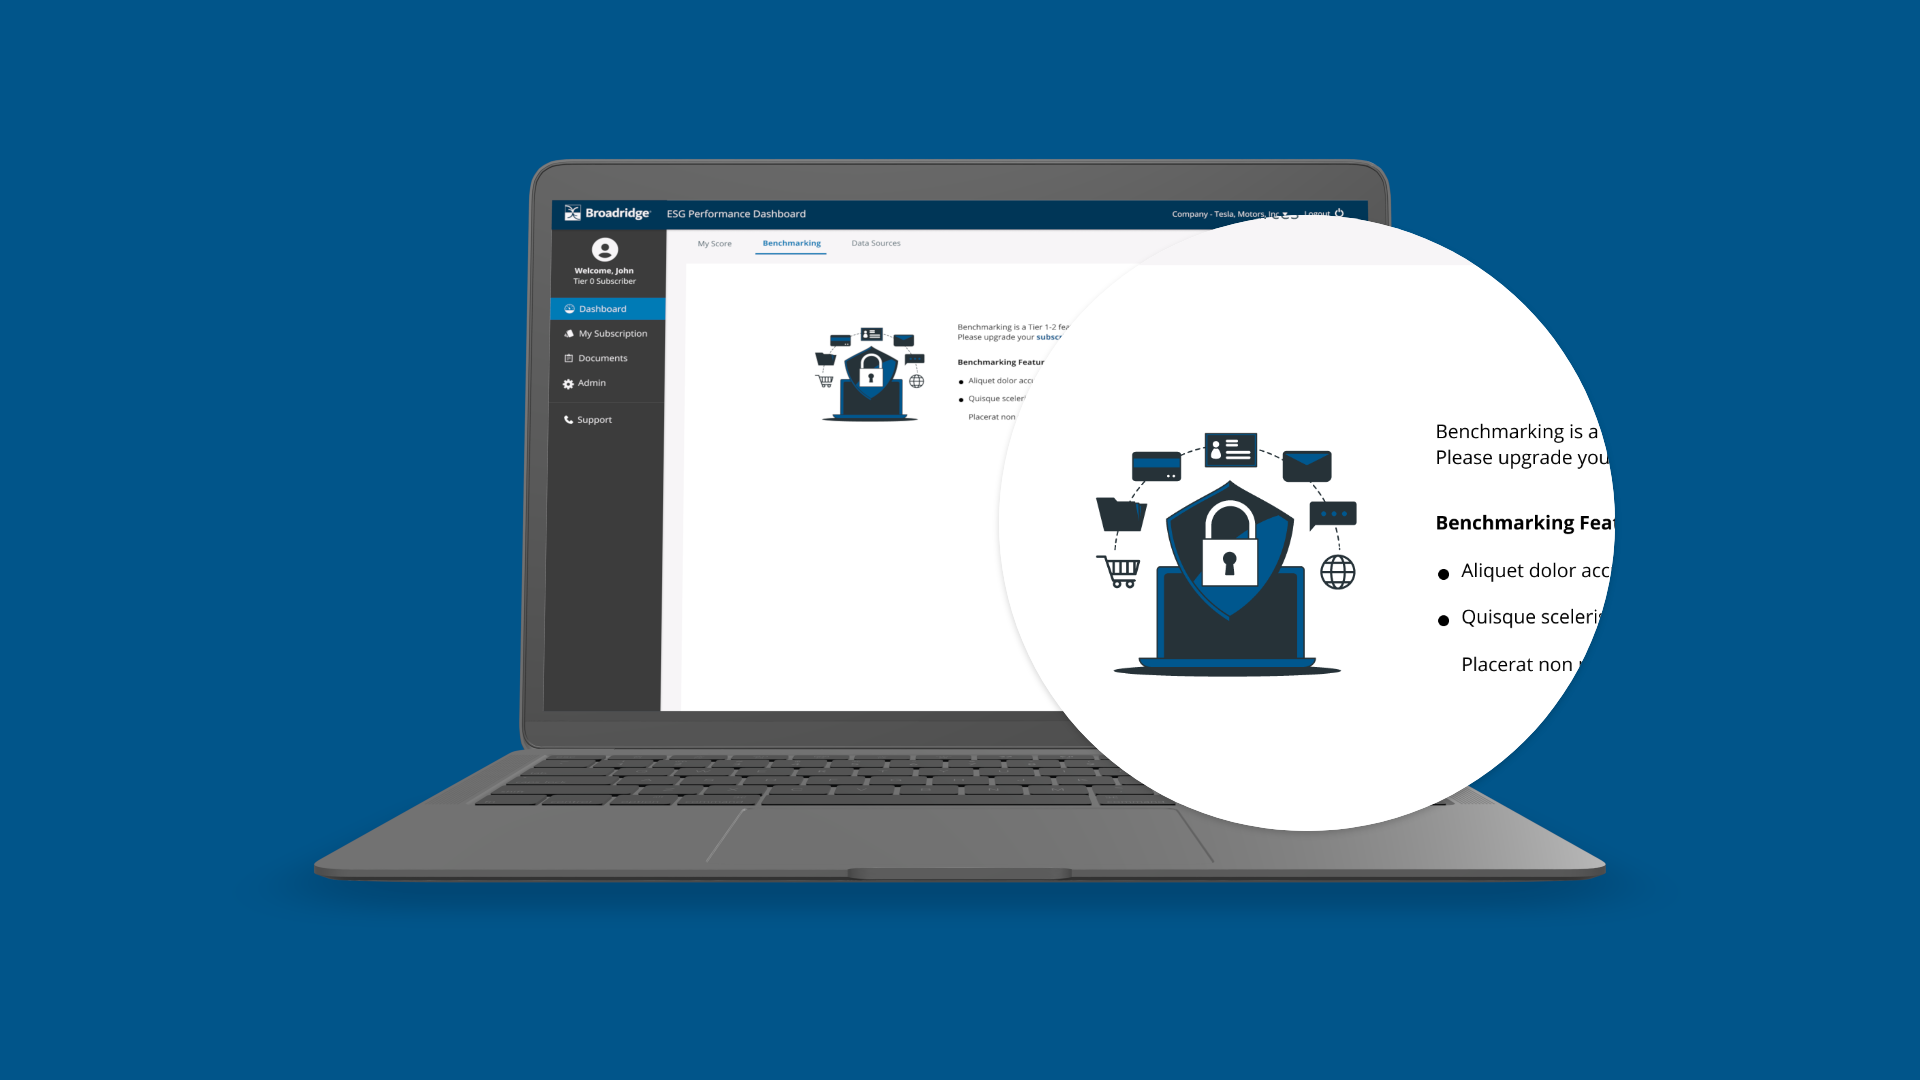
One of the selling factors of the application is the different tiers of memberships offered by Broadridge. There is a free membership and a Tier 1 and a Tier 2 membership. I created this "limited subscriber" pattern where a free user can preview the features exclusive to paid users through illustrations and descriptive texts. The addition of a premium look and feel for paid subscribers increase the value of subscribing.
The project involved the collaboration of Marketing and CSRHub's Development Team. My role was to ensure all 3 were equally involved.

Work
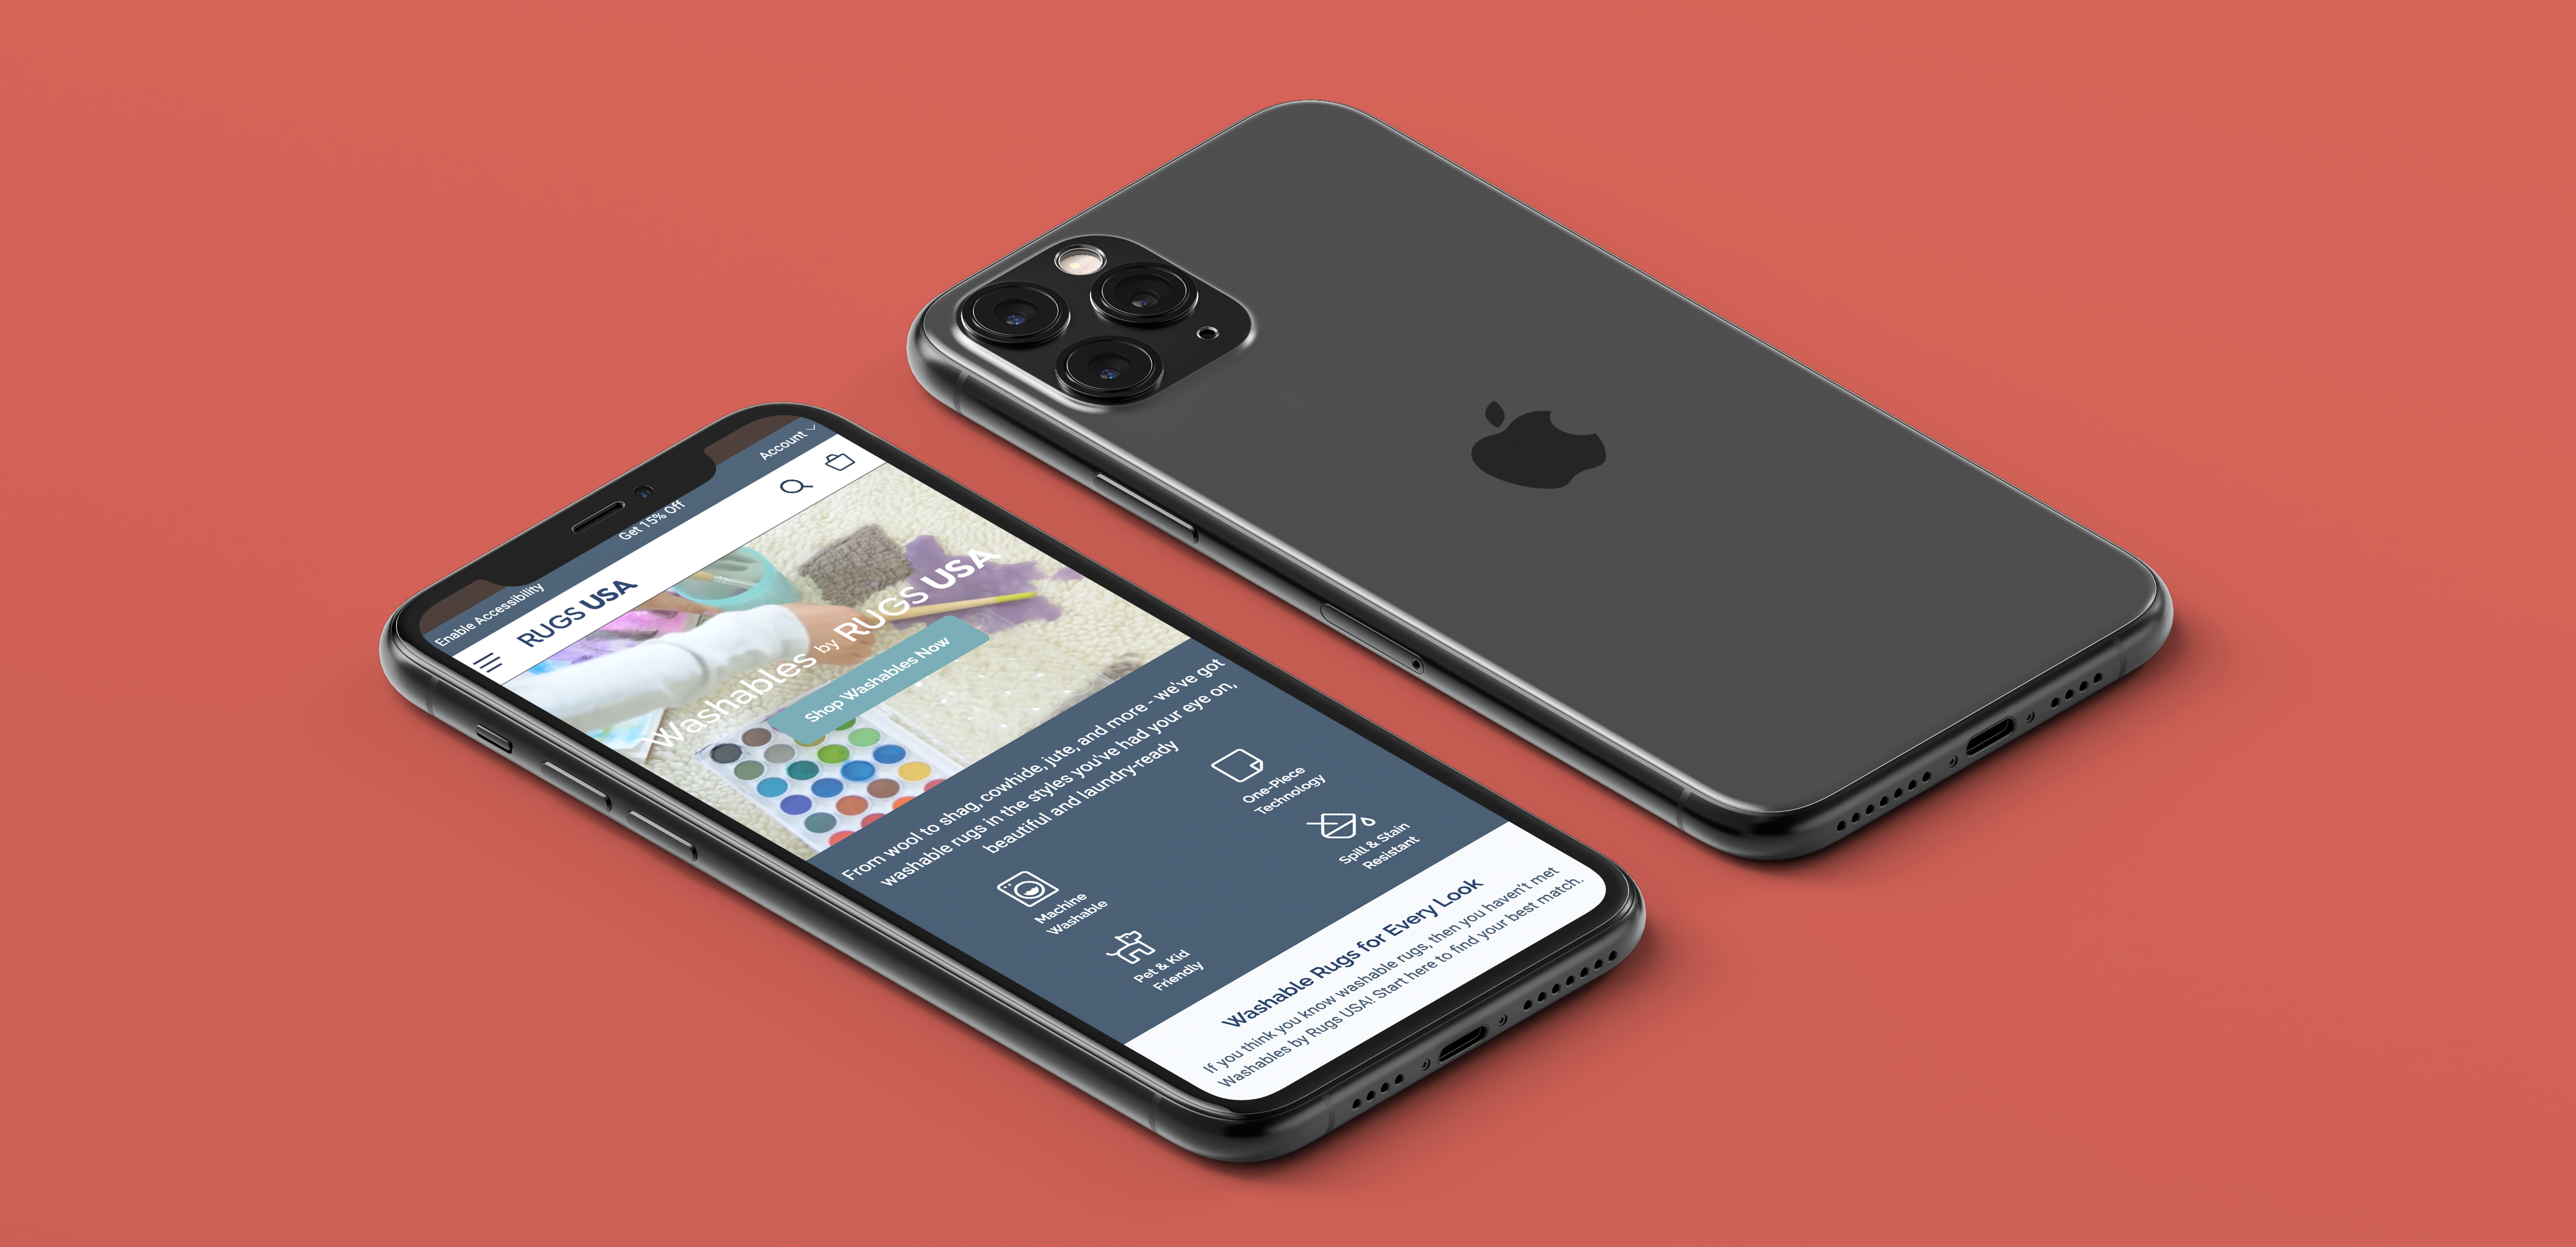
RUGS USAProject type
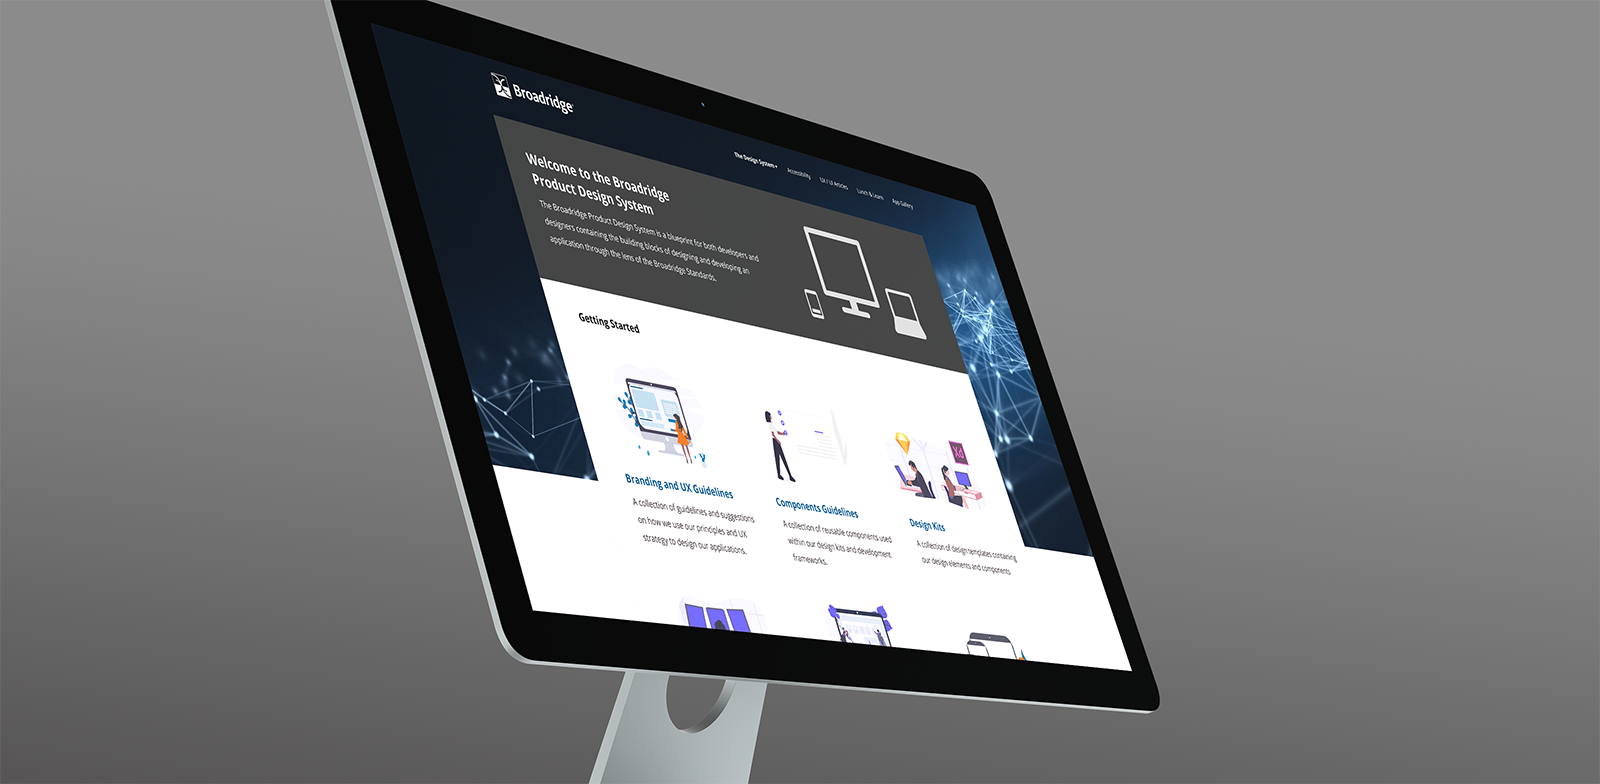
Broadridge Design SystemUX Design
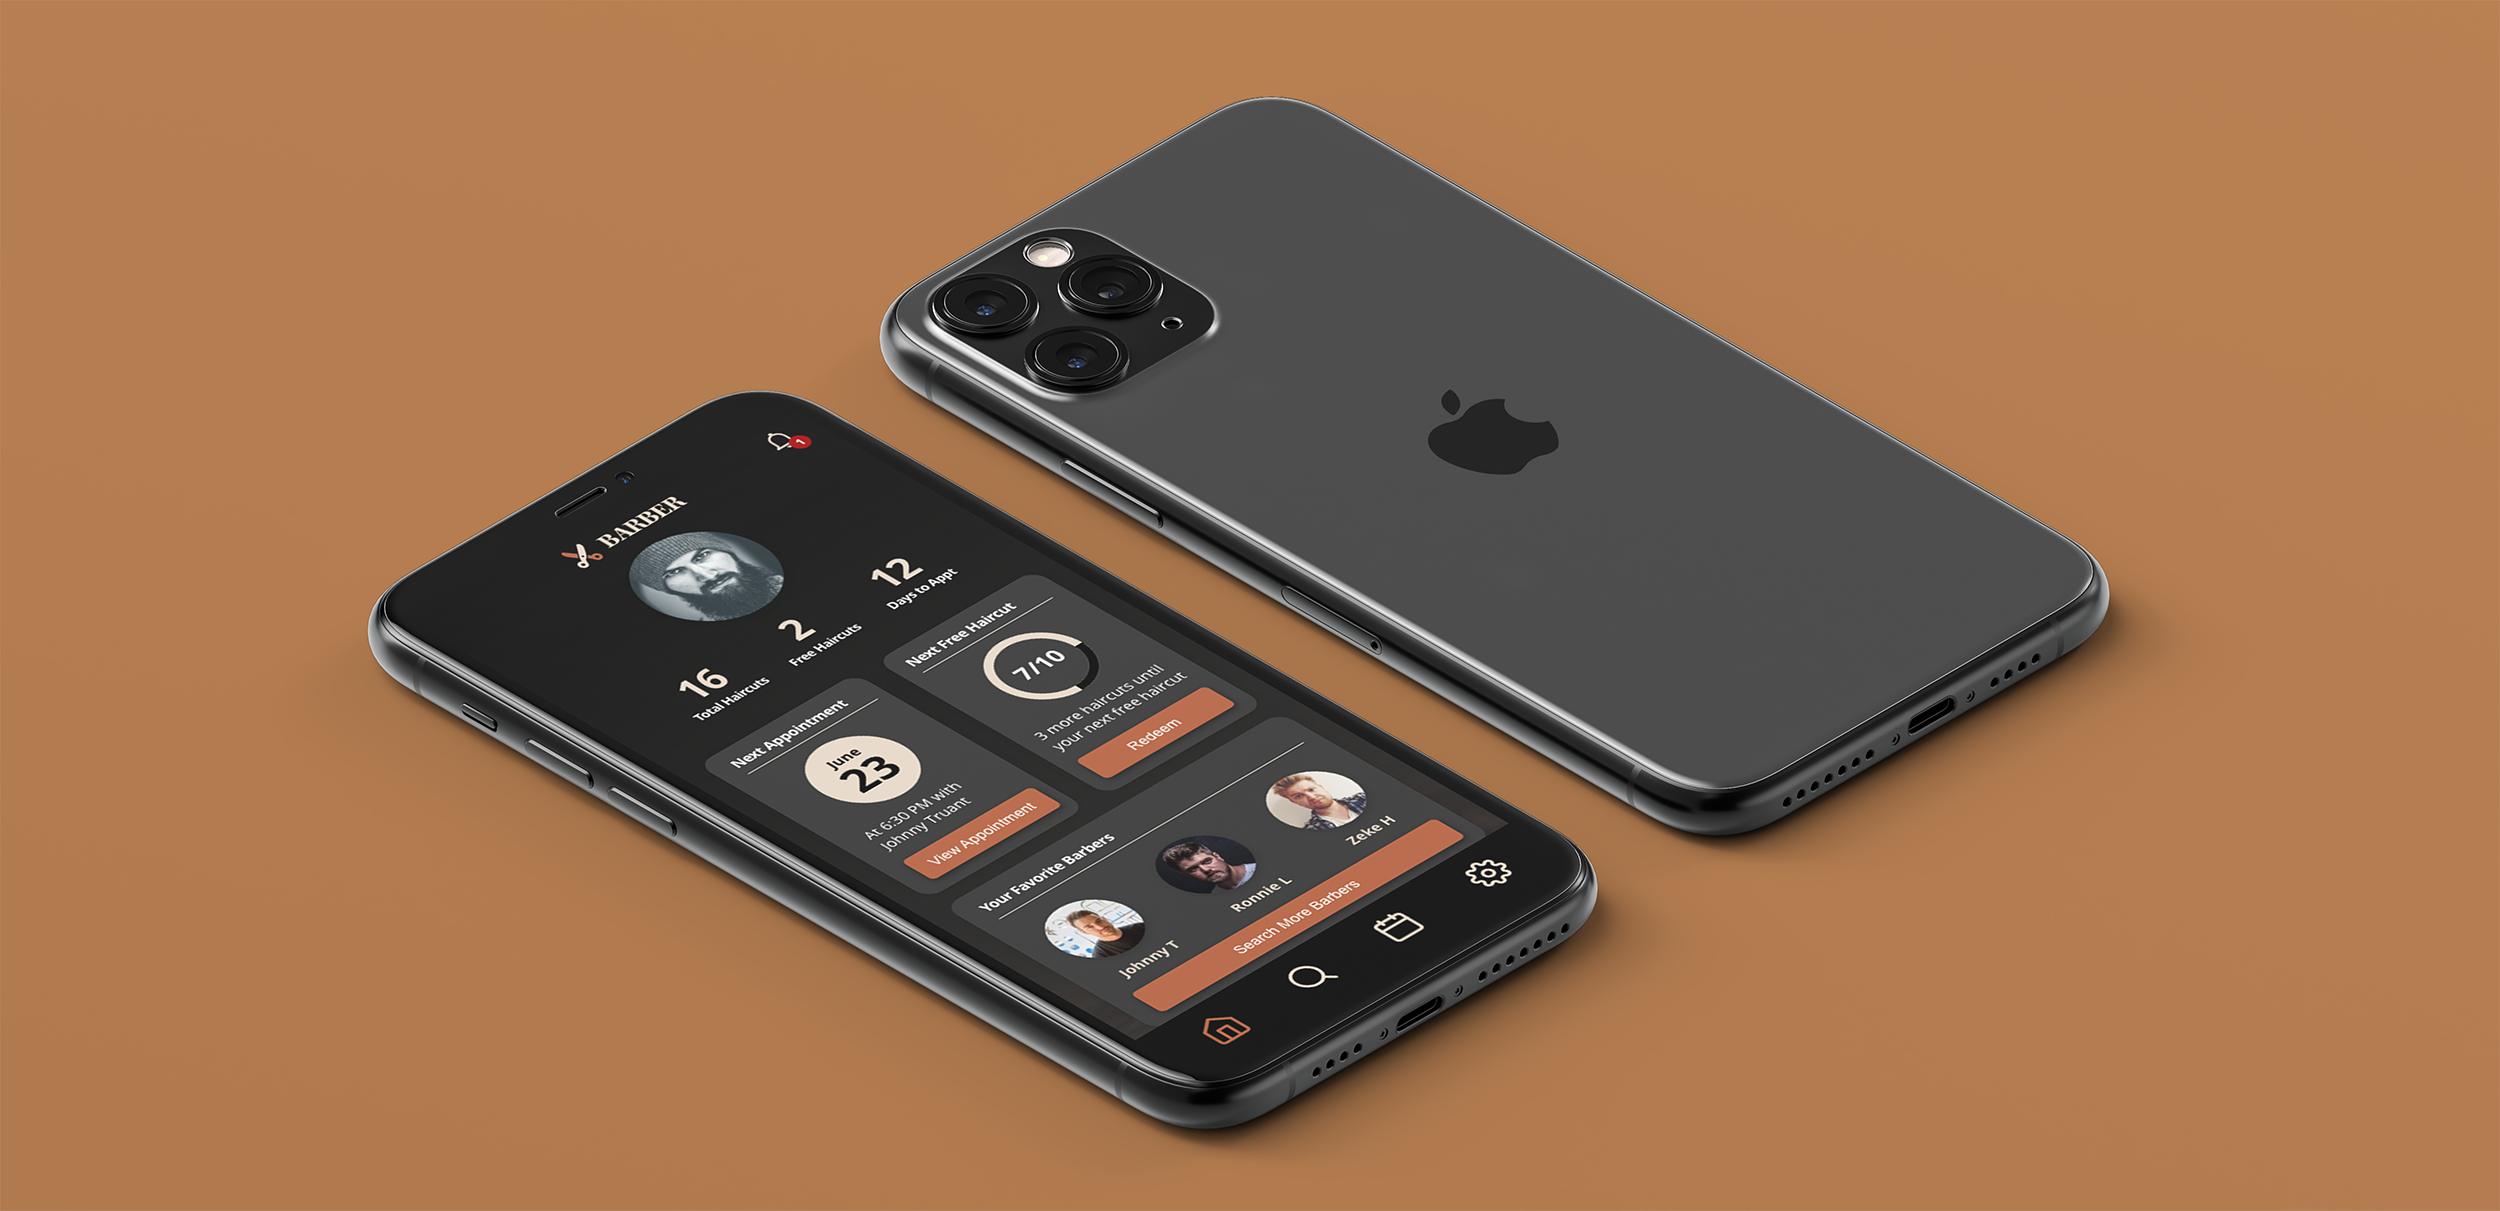
Barber AppProject type
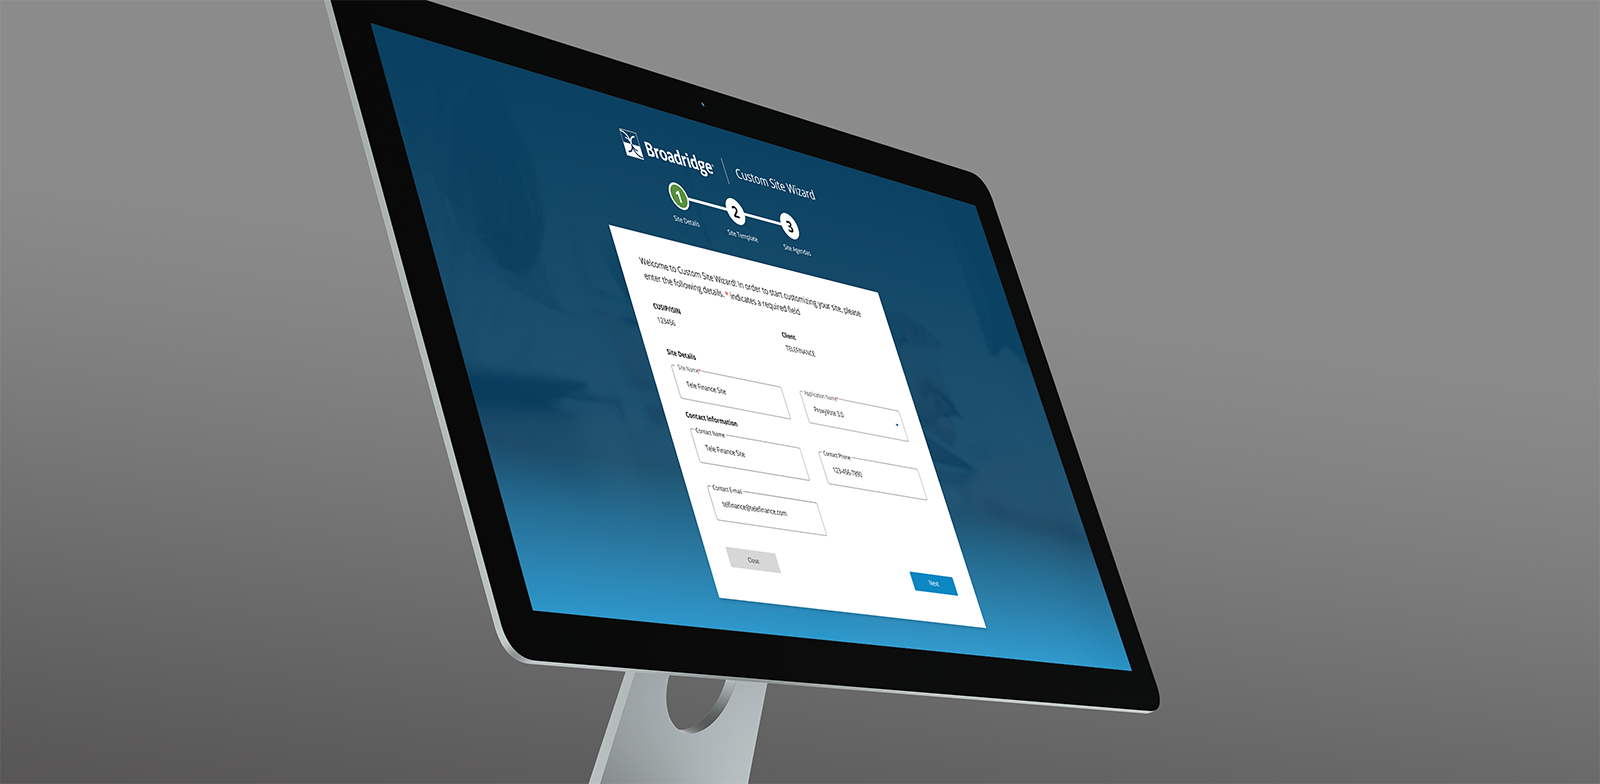
Custom Site WizardProject type
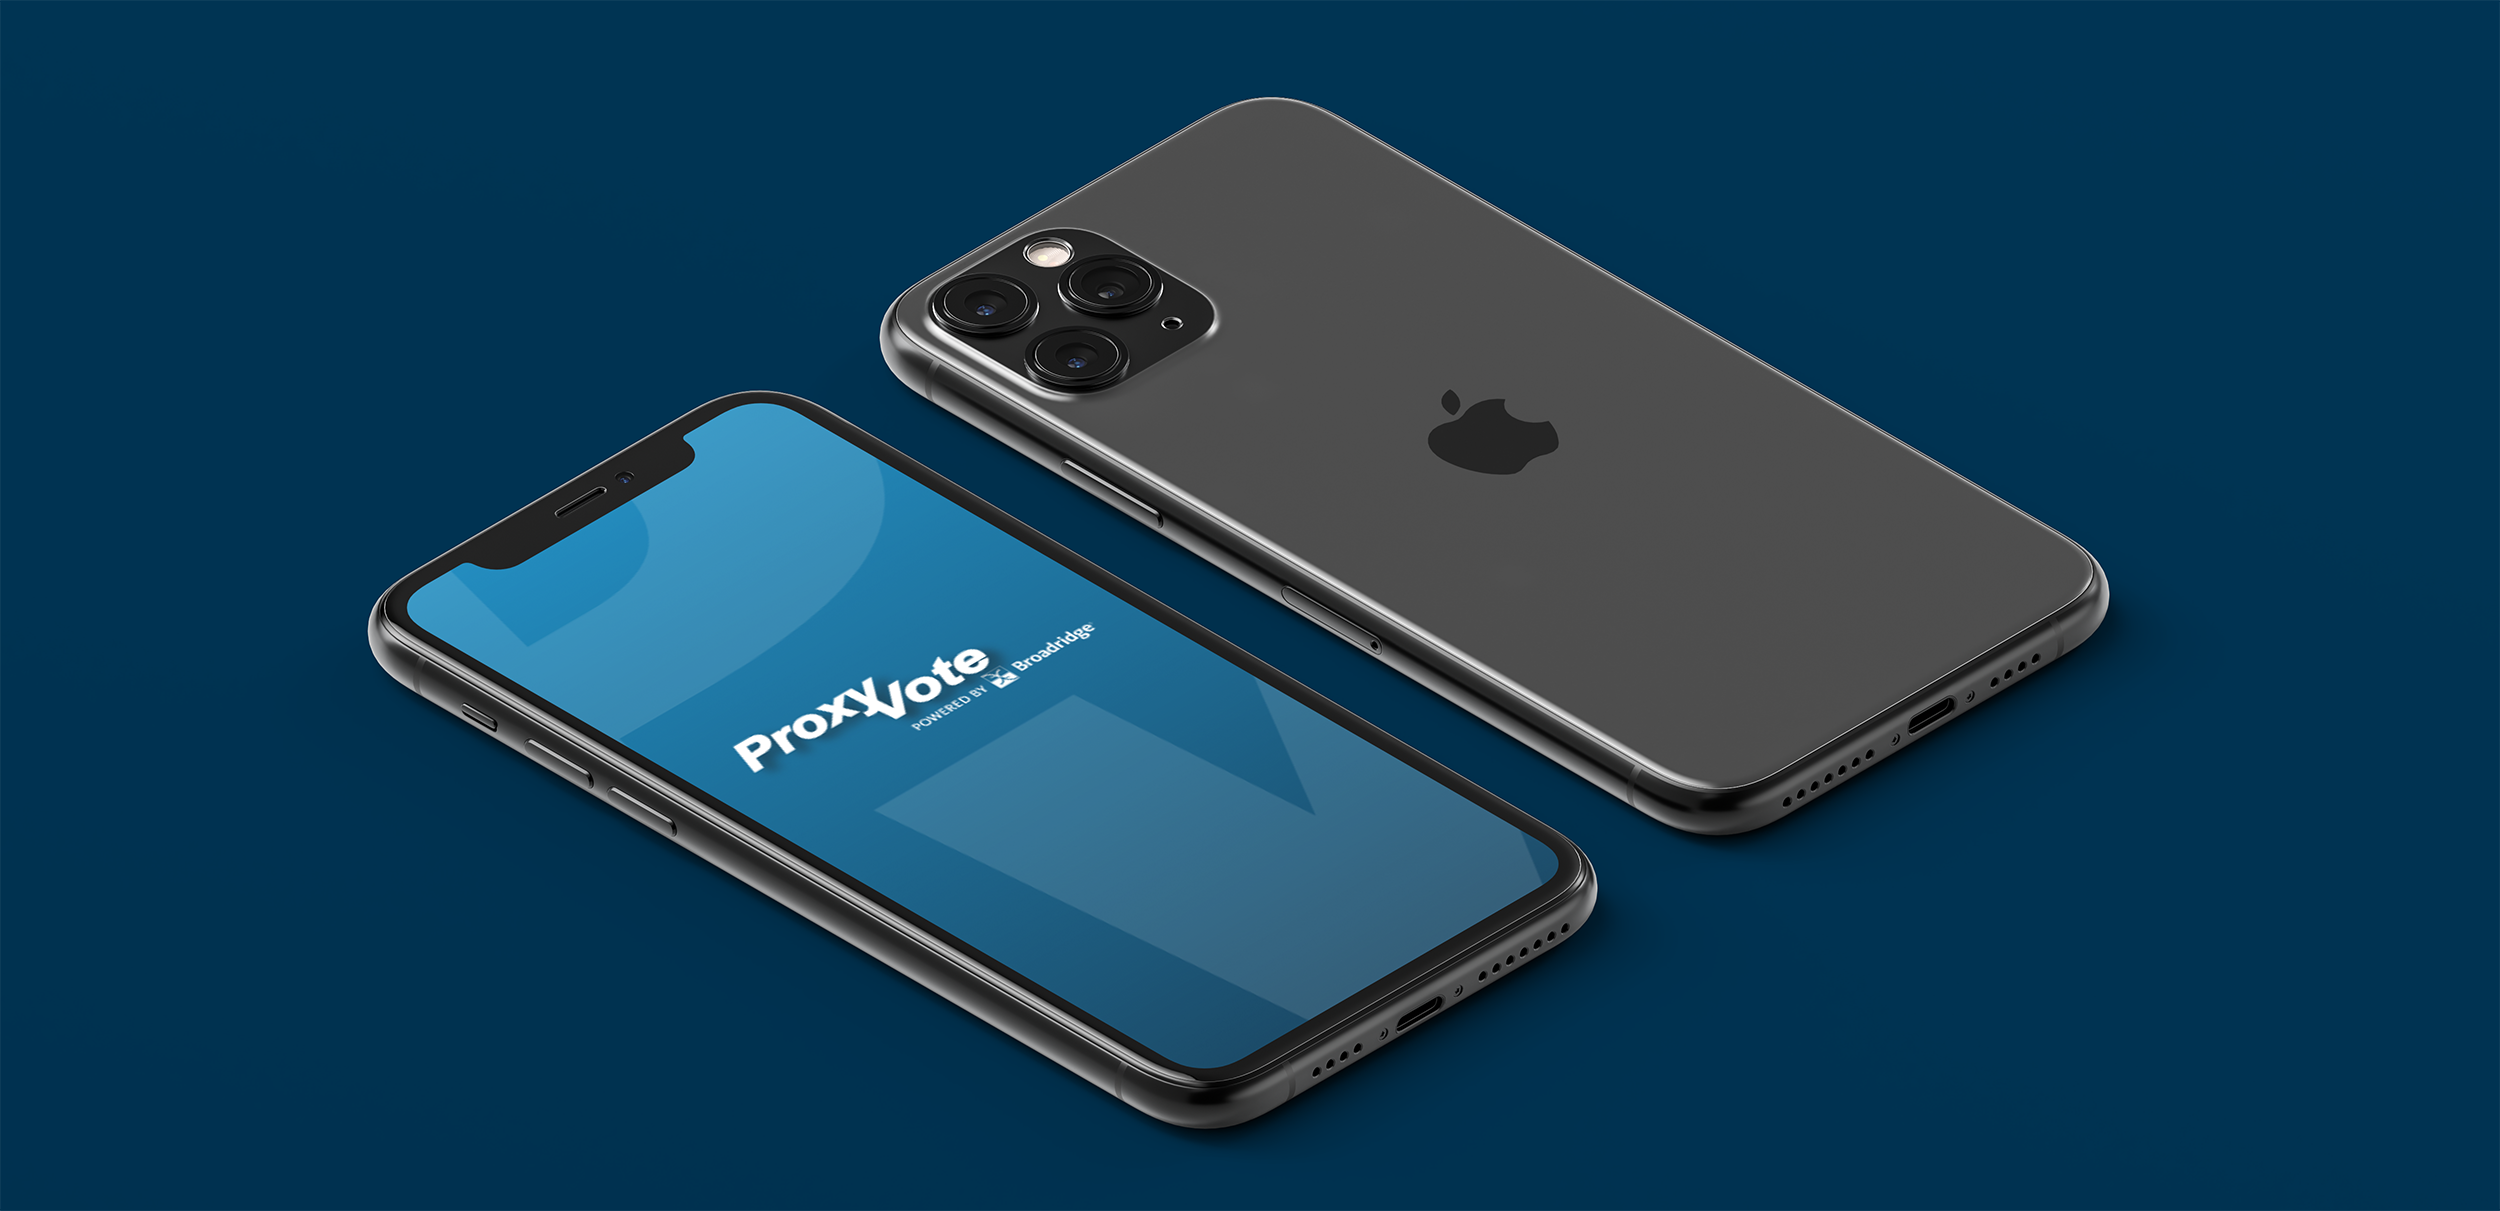
ProxyVoteProject type
ESG Performance DashboardProject type
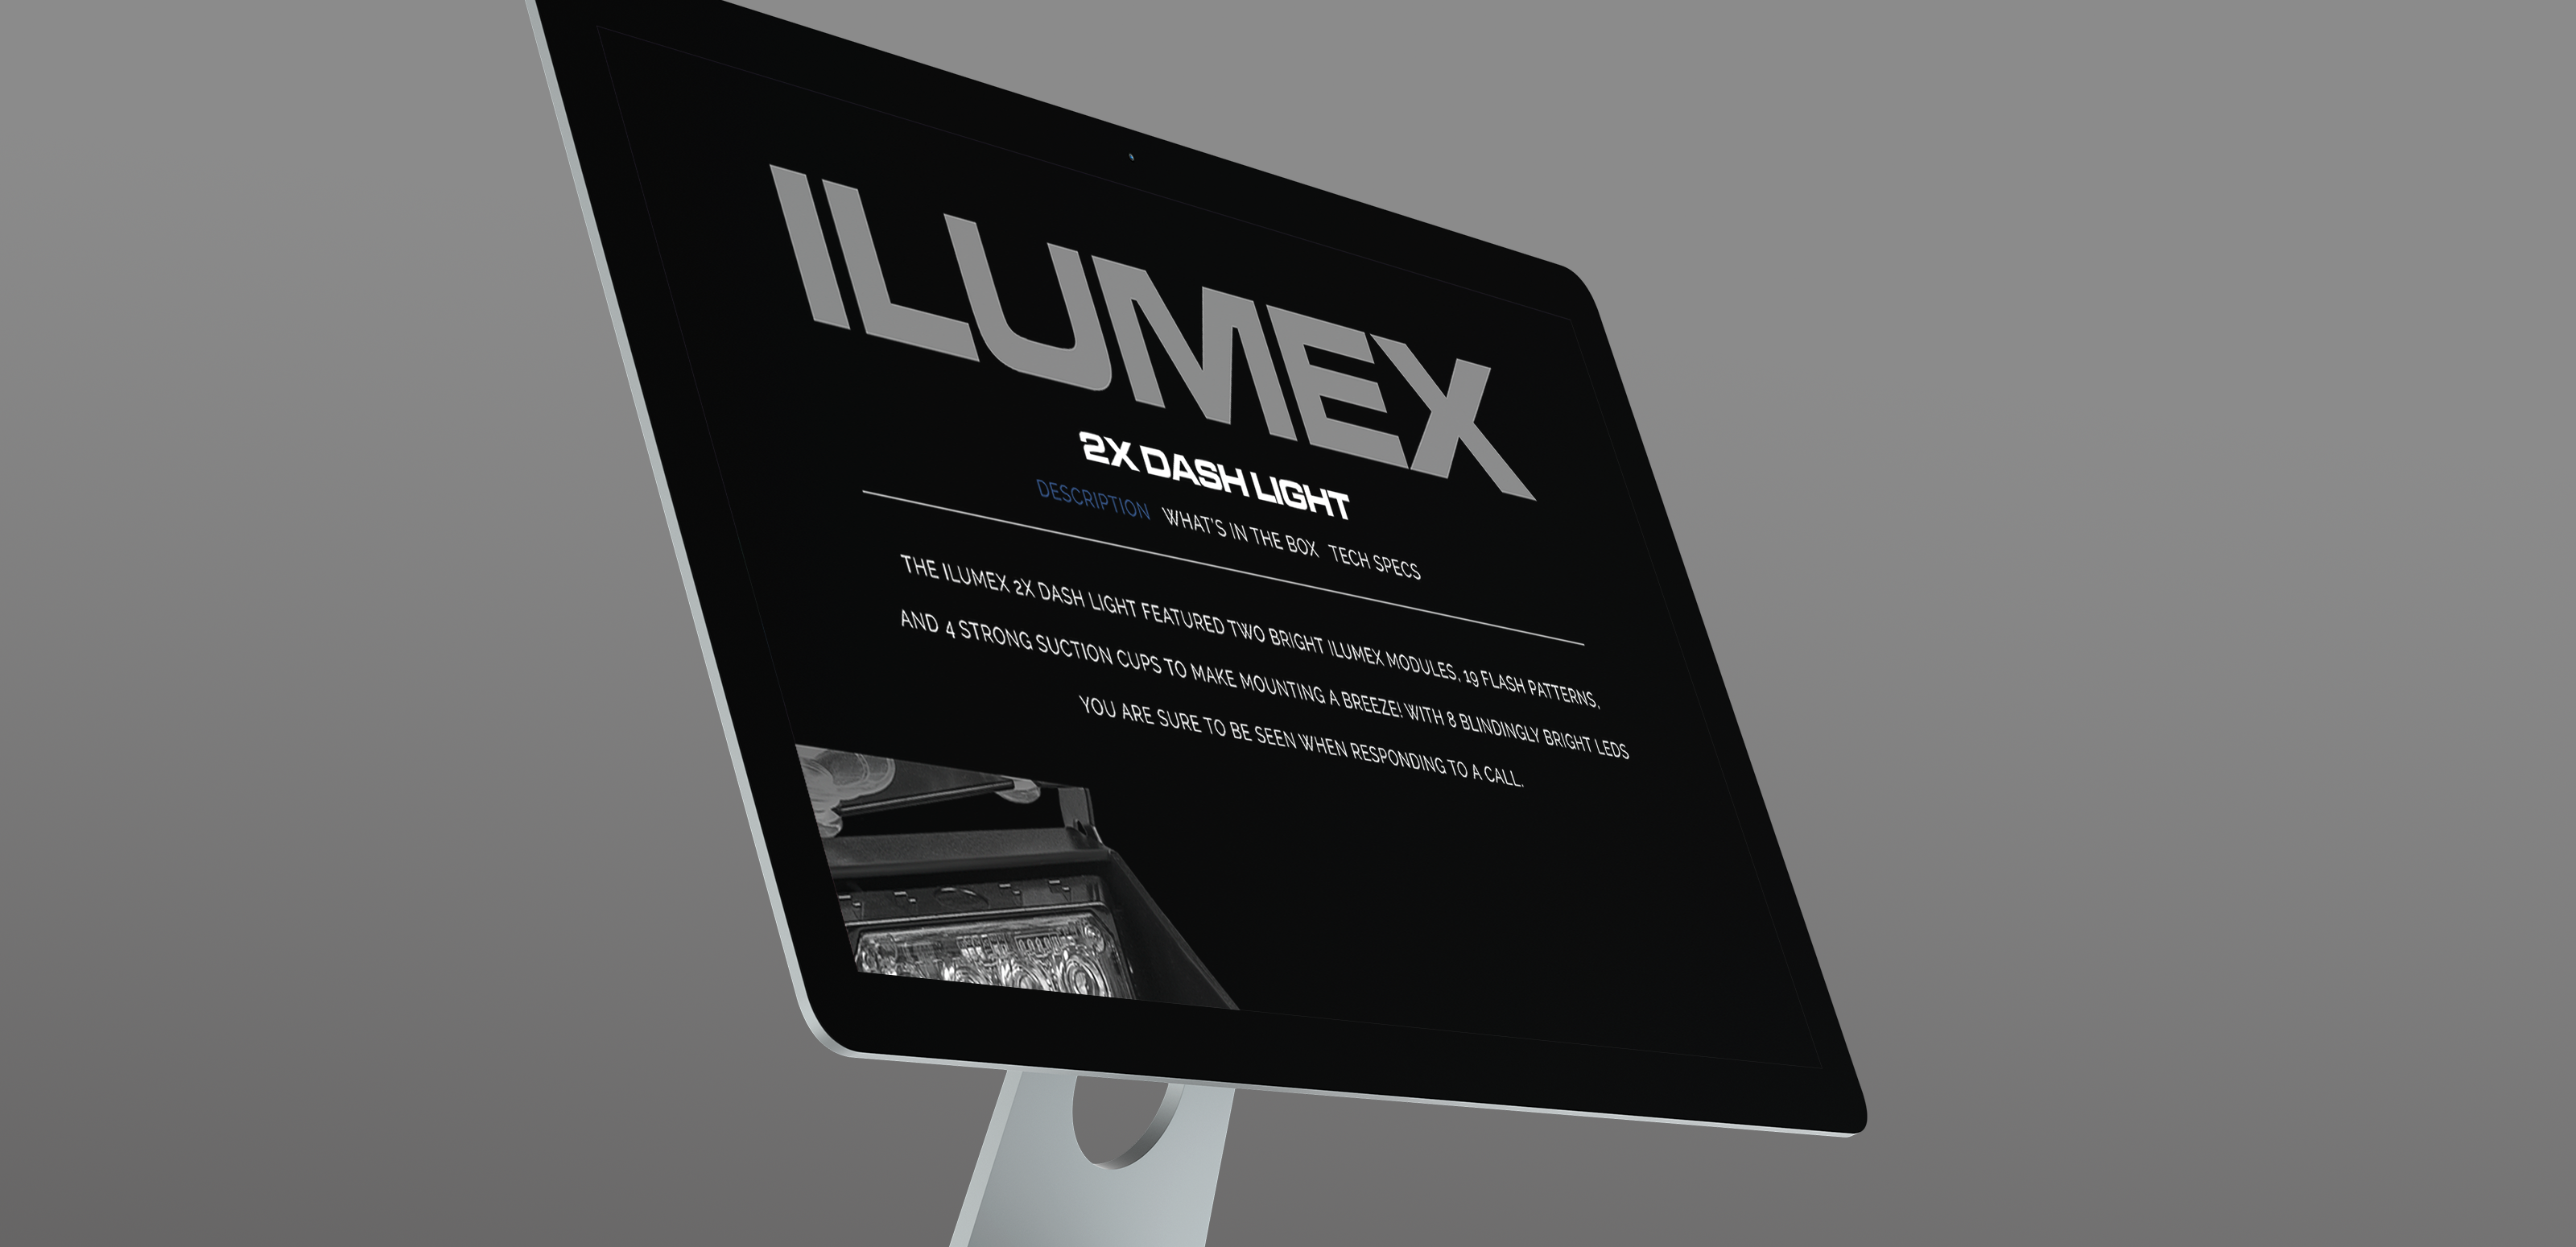
Ultra Bright LightzProject type